Excel

Tipos de Gráficos Excel


chart add in

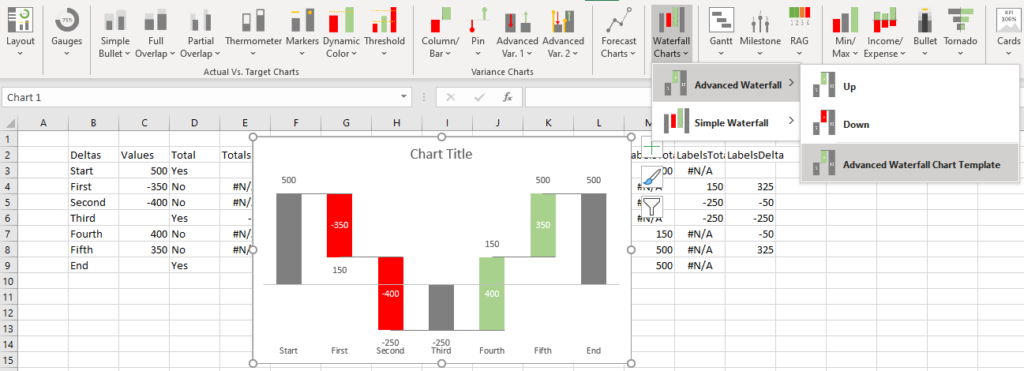
PINE BI: El Complemento Definitivo para Gráficos de Excel: Inserte gráficos personalizados con un simple clic y otras herramientas de gráficos!


Excel proporciona casi 50 tipos de gráficos listos para usar. Excel también permite una personalización casi ilimitada de los gráficos, mediante la cual se pueden crear muchos otros tipos de gráficos comunes.

La siguiente lista contiene enlaces a nuestros tutoriales sobre los gráficos integrados en Excel así como también los gráficos avanzados personalizados.

Excel Charts
Excel Built-in Chartsyes
Column Charts: Stacked, Clustered
Bar Charts: Stacked, Clustered
Area Charts
Line Charts
Candlestick Charts
Pareto Chart
Waterfall Chart
Sales Funnel Chart
Advanced Custom Chartsyes
Gauge / Dial Chart
Tornado Chart
Burndown Chart
Step Chart
Thermometer Chart
Quadrant Chart
Bullet Chart
Ogive Chart
Bell Curve / Normal Distribution Plot
Stem & Leaf Chart
Mekko Chart
Venn Diagram
Polar Plot
Venn Diagram
Panel Chart
Timeline Chart
Progress Charts
Sales Funnel Chart
Floating Bar Chart
Forest Plot
Frequency Polygon
Arrow Chart
Percentage Graph
Time Series Graph
Percentage Change Chart
Show Percentage in Pie Chart
Dot Plot
Q-Q Plot
Log-Log Plot
Normal Probability Plot
Charts Tips & Tricksyes
Add or Move Data Labels
Add Data Series
Add Average Line
Add Data Points
Add Error Bars
Add Gridlines
Add Line of Best Fit
Add Title
Break Chart Axis
Calculate Area Under Curve
Plot Residuals
Change Bar Chart Width
Change Chart Colors
Chart Axis Text Instead of Numbers
Copy Chart Format
Create Chart with Date or Time
Curve Fitting
Export Chart as PDF
Add Axis Labels
Add Secondary Axis
Change Chart Series Name
Change Horizontal Axis Values
Create Chart in a Cell
Graph an Equation or Function
Overlay Two Graphs
Plot Multiple Lines
Rotate Pie Chart
Switch X and Y Axis
Insert Textbox
Move Chart to New Sheet
Move Horizontal Axis to Bottom
Move Vertical Axis to Left
Remove Gridlines
Reverse a Chart
Rotate a Chart
Rounded Corners or Shadows
Create, Save, & Use Excel Chart Templates
Dynamic Chart Titles
Chart Conditional Formatting
Dynamic Chart Range
Animated Charts
Interactive / Dynamic Charts

AI Formula Generator

Pruébelo Gratis


Preguntas Frecuentes sobre Gráficos de Excel

¿Cuántos tipos de gráficos ofrece Excel?

Excel ofrece casi 50 tipos de gráficos. Entre ellos, gráficos de barras, circulares y muchos más. Excel también permite opciones de personalización prácticamente ilimitadas que le permiten crear gráficos avanzados.

¿Cómo cambiar el estilo de un gráfico en Excel?

Para cambiar el estilo del gráfico en Excel, seleccione su gráfico, vaya a Diseño de Gráfico > Estilos de Gráfico, y seleccione un estilo de gráfico alternativo.

¿Cómo cambiar el tipo de gráfico en Excel?

Para cambiar el tipo de gráfico en Excel, seleccione el gráfico, vaya a Diseño de Gráfico > Cambiar tipo de gráfico y seleccione un tipo de gráfico alternativo.